The Dallas/Fort Worth Metroplex is located in north central Texas, approximately 250mi/400km north of the Gulf of Mexico. It is near the headwaters of the Trinity River, which lie in the upper margins of the Coastal Plain. The rolling hills in the area range from 500ft to 800ft/150m to 240m in elevation. The Dallas/Fort Worth climate is humid subtropical with hot summers. It is also continental, characterized by a wide annual temperature range. Precipitation also varies considerably, ranging from less than 20in/51cm to more than 50ins/127cm. Winters are mild, but “blue northers” occur occasionally, and often are accompanied by sudden drops in temperature. Average low temperatures drop to 33°F/1°C in early to mid January. Periods of extreme cold that occasionally occur are short-lived, so that even in January mild weather occurs frequently. The highest temperatures of summer are associated with fair skies, westerly winds, and low humidities. Characteristically, hot spells in summer are broken into three-to-five day periods by thunderstorm activity. There are only a few nights each summer when the low temperature exceeds 80°F/27°C. Summer daytime temperatures frequently exceed 100°F/38°C. Air conditioners are recommended for maximum comfort indoors and while traveling via automobile. For over three weeks from late July to mid August, average high temperatures are at their peak of 96°F/36°C. Throughout the year, rainfall occurs more frequently during the night. Usually, periods of rainy weather last for only a day or two, and are followed by several days with fair skies. A large part of the annual precipitation results from thunderstorm activity, with occasional heavy rainfall over brief periods of time. Thunderstorms occur throughout the year, but are most frequent in the spring. Hail falls on about two or three days a year, ordinarily with only slight and scattered damage. Windstorms occurring during thunderstorm activity are sometimes destructive. Snowfall is rare. The average length of the warm seasons (freeze-free period) is about 248 days, or about 8 months. The average last occurrence of 32°F/0°C or below is mid March, and the average first occurrence of 32°F/0°C or below is in mid to late November. |
|||||||||||||||||||||||||||||||||||||||||||||||||||||||||||||||||||||||||||||||||||||||||||||||||||||||||||||||||||||||||||||||||||||||||||||||||||||||||||||||||||||||||||||||||||||||||||||||||||||||||||||||||||||||||||||||||||||||||||||||||||||||||||||||||||||||||||||||||||||||||
|
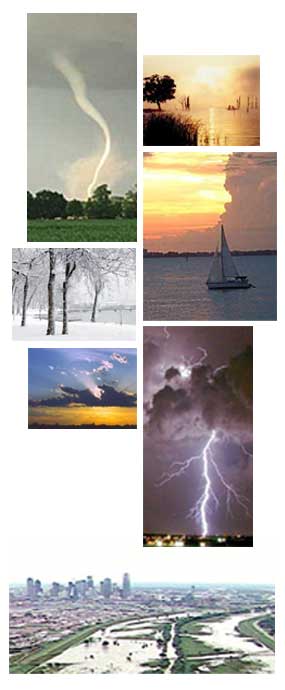
Weather and climate are important factors in determining what type of wildlife an area can support. The following charts provide climate statistics for the five county area through every month of the year. |
|||||||||||||||||||||||||||||||||||||||||||||||||||||||||||||||||||||||||||||||||||||||||||||||||||||||||||||||||||||||||||||||||||||||||||||||||||||||||||||||||||||||||||||||||||||||||||||||||||||||||||||||||||||||||||||||||||||||||||||||||||||||||||||||||||||||||||||||||||||||||
|
|||||||||||||||||||||||||||||||||||||||||||||||||||||||||||||||||||||||||||||||||||||||||||||||||||||||||||||||||||||||||||||||||||||||||||||||||||||||||||||||||||||||||||||||||||||||||||||||||||||||||||||||||||||||||||||||||||||||||||||||||||||||||||||||||||||||||||||||||||||||||
|
|||||||||||||||||||||||||||||||||||||||||||||||||||||||||||||||||||||||||||||||||||||||||||||||||||||||||||||||||||||||||||||||||||||||||||||||||||||||||||||||||||||||||||||||||||||||||||||||||||||||||||||||||||||||||||||||||||||||||||||||||||||||||||||||||||||||||||||||||||||||||
| * Data for this page collected from Nation Weather Servive Southern Region Headquarters | |||||||||||||||||||||||||||||||||||||||||||||||||||||||||||||||||||||||||||||||||||||||||||||||||||||||||||||||||||||||||||||||||||||||||||||||||||||||||||||||||||||||||||||||||||||||||||||||||||||||||||||||||||||||||||||||||||||||||||||||||||||||||||||||||||||||||||||||||||||||||

DFW Urban Wildlife
Documenting the Diversity of Dallas/Fort Worth Urban Wildlife Since 2005
